

Table of Contents
Introduction
In this post you’re going to learn about what is my #1 Forex Trading stategy.
The strategy is my favourite only because it makes me the most amount of money based on data that I’ve collected on over 2K Forex Trades in the past 4 years.
I hope you enjoy 🙂
My Favourite Trading Strategy for FX
In short, the strategy consists of scanning for stocks that are forming a certain pattern. The reason why I called this my favourite is that it works most often for me.
People are different, you might be a different story. I always recommend you to develop your own angle and your own personal trading strategy.
I myself, have gone and tested through 30+ chart patterns, each with hundreds of trades and this one pattern has outperformed all the rest.
The pattern
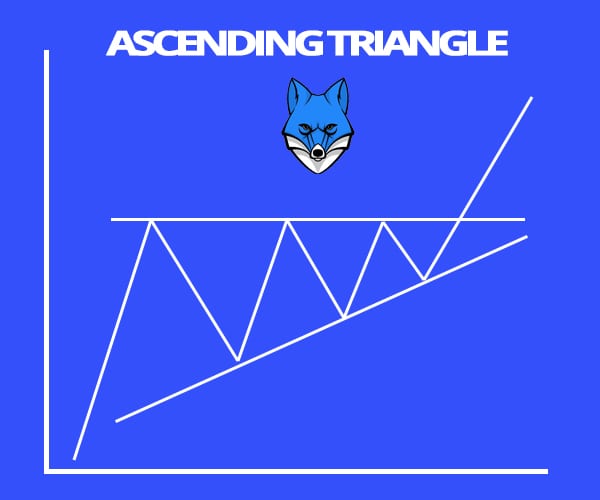
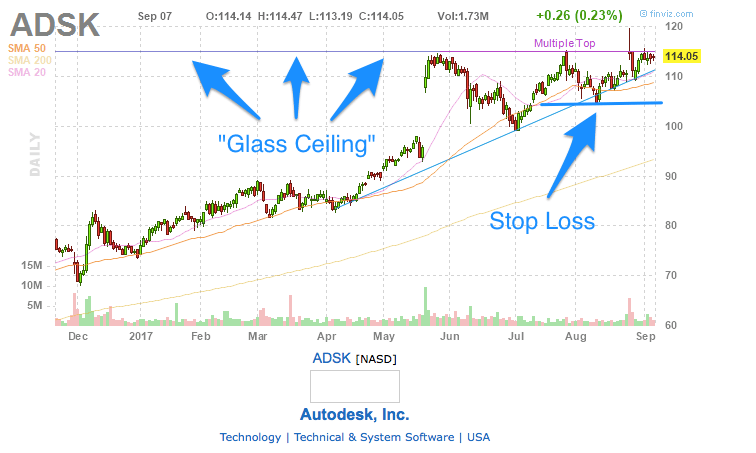
The pattern is called the ascending triangle (AT). It forms when the price of the instrument seems to gather upward momentum by coming closer to a “glass” ceiling that it has trouble breaking at first.
More times than not, when the ceiling breaks, the price will continue shooting higher. I personally have an above 70% success rate with this specific pattern.
I like to enter as soon as the resistance level is broken and I set my stop loss below the previous low. Check the example below to see an illustration of this:
Risk/Reward Ratio (RRR)
In these set-ups, I’m looking to make at least 1.5:1 risk return ratio. Meaning that if I risk 50 pips, I’m looking to make around 75 pips. I also look at the price action, if the break-out is really strong, I may let it run for a little longer, while paying attention to not losing the profits that I’ve already made.
I always save the chart patterns that I use for trading and enter the trade into my trading journal. If the pattern is not working, I also check if I should adjust the RRR.
If my diary would tell me that I’m profitable on only 40% of these trades, I would need to adjust my RRR so that for every 50 pips that I’m risking, I would be aiming to make more than 125 pips to be profitable in the long run.
One ratio is a function of the other, if you adjust your stats, you will also see shifts in your RRR or profitability ratio. When you’re just starting out, I suggest you try this with a 1.5:1 risk reward ratio. When you get some experience and collect your own data, you can start adjusting.
Purity Grades
If you’ve read any of my other strategy articles, you probably already know that I like to grade all the patterns once I enter into a trade (just like them scientists grade hurricanes).
My grading is based on how pure the patterns are. The perfect set-up being a 10 on a 0-10 scale. With the AT, I’ve been able to be profitable with patterns that start from grade 6. This is the lowest of the patterns I’ve used. Most other price patterns require a minimum of 8 to be profitable in the long run.
What About the Descending Triangle?
A descending triangle (DT), is the opposite of the AT. It happens when the price is heading down and can’t seem to break through a glass floor. It bounces off of it and every time the bounce seems to have less energy. 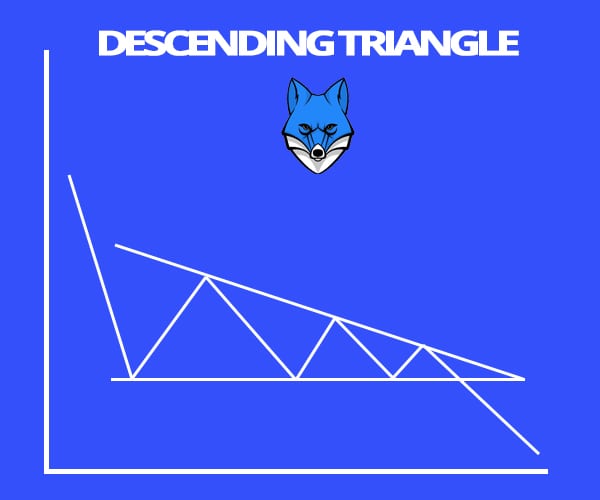
The descending triangle works just as good as it’s brother AT. The success rate is about the same, which means that you have twice as many opportunities as you would have when only trading these on the long side.
Examples of the Pattern
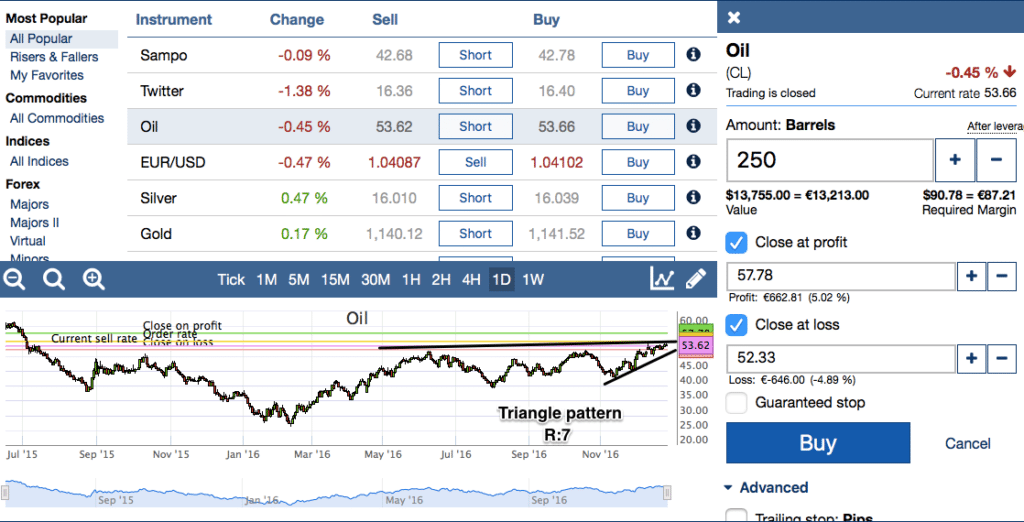
Oil: In the example above, we have oil price trying to break to new highs. The chart has formed a rather sharp ascending triangle. I’ve given it a 7, because the ending of the chart is a bit messy. With the triangle patterns, 7 is a good enough grade to take a trade.
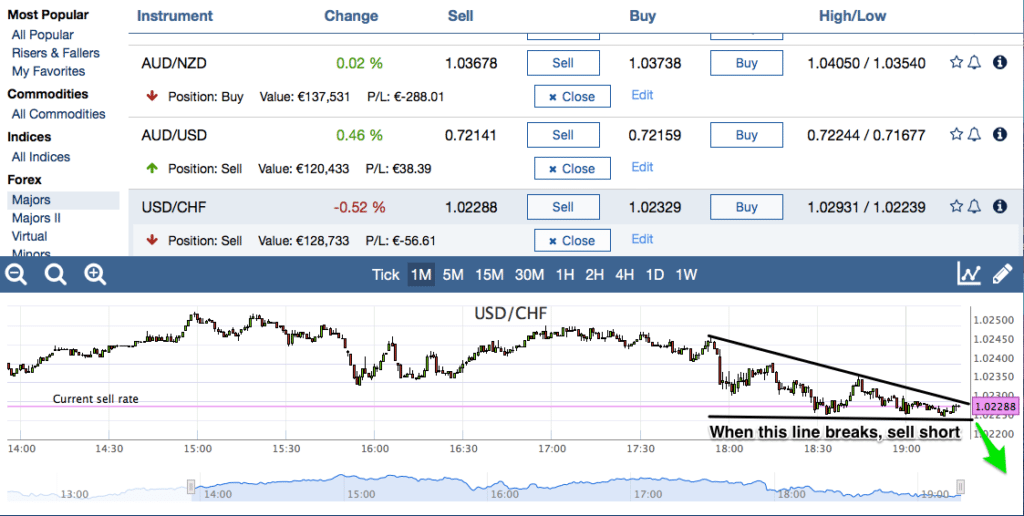
USD/CHF: The above chart is clearly in a downwards trend and in a descending triangle formation. The formation is rather clean and thus could provide a decent trading opportunity. Here we would be looking for the bottom trend line brake before entering.
Triangle patterns are fairly profitable, although they are harder to find compared to some other simpler set-ups like channels and trends. The clearer the shape, the likelier it is to play out in a predictable way.
I recommend to take the time to record the patterns you trade and rate them. When you’ve collected sufficient data, you are able to forecast which grades yield profitable trades and which do not.
How to Find This Pattern
When trading forex, all you need to do is go through the charts of different currency pairs. Don’t be afraid to check through the less liquid pairs as well. You don’t need to stick to the big pairs, it would limit the amount of opportunities available.
When checking various pairs, browse different time periods starting from longer and moving towards shorter term periods. This way you’ll be able to start from a more broader view of the market sentiment and zoom in to spot possible set-ups in shorter timeframes.
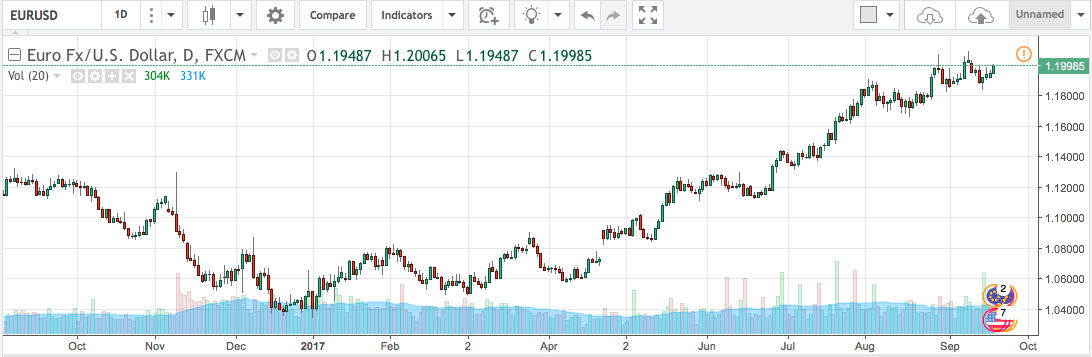
For example, this EUR/USD chart shows us that the pair has been trending higher since the beginning of 2017. So in general, we would conclude that the pair is riding an uptrend.

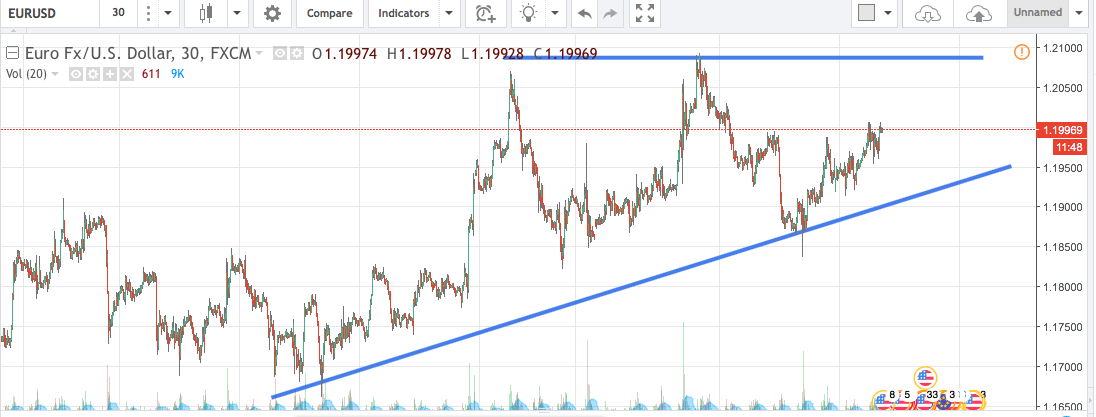
If we zoom in to a shorter time frame like 4 hour candles, we could see that the pair is slowly pushing higher towards a local high. There is a small ascending triangle forming here. I wouldn’t touch it before it starts to form a more clearer pattern. However this is something that I would be interested in.
While writing this post, I did add the pattern to my watch list to see how it develops. It might get interesting by breaking the previous high, which is where I would jump in with a long trade. In the present case however the pattern isn’t clear enough for me to enter a pending order straight away.
When entering into a trade, it is best to zoom in even further to pay close attention to the support and resistance levels. Previous highs and lows tend to be a significant point of interest for a lot of traders, which makes these levels important. Whenever they brake, there might be some action ahead.
I go through all the main currency pairs to hunt for the triangle pattern. Whenever I find a really good one, I will buy/sell or put in a pending order. If the pattern isn’t clearly developed yet, I’ll add it to my watch list like in the case above.
Conclusion
As you probably understood, finding a unicorn triangle pattern is tedious work and only happens every so often. However when you do find one, it usually is worth the hustle.
Going through all the various patterns of the main currency pair may seem boring, but I am not hunting for a single pattern, I have 4-5 main set-ups that I’m looking for. I almost always find something to add to my watchlist or take a trade on immediately.
Oh and please understand that Triangles is my favourite only because I have had the most success with them. I strongly advise you to test out various patterns. Find and record them. Keep track of your results (with a paper account at first if you’d like) and find out which patterns work the best for you.
You need to put in the work to actually get results. The majority of which consists of analysing your trades to adjust and improve in the future. This is the only way to give yourself a true chance of success.
Good luck with your trading ventures!
Paul
NB! Please feel free to drop me a line in the comments section if something is unclear or should you have any additional questions. Yours personal experience with the pattern is more than welcomed.


Thanks Paul. I just stumbled upon your Article on your trade strategy and i think i love the triangles too but you know one can never just get done learning things about same thing he knows already. Trying to say i learnt more from your wonderful Article and i think i will always have the pleasure reading more of your Articles. Also i just followed twitter so i could always get your Updates (My Twitter Handle: @johnsonmercyi). Thanks 🙂
Hey Johnson, thank you for the kind words!