
Table of Contents
You tend not to find that much information about triangle chart patterns in beginner guides to trade.
This is something which has always baffled me, because not only is understanding triangle chart patterns dead simple, but when you have nailed how they work you will have opened a lot of doors when it comes to informed trading decisions.
Basically; you need to understand how they work in order to become a successful trader. You will be leaving money on the table otherwise.
That is what this guide is all about. Introducing you to this type of chart.
What Are Triangle Trading Patterns?
Triangle patterns are specific trends on a price chart. As the name suggests, they are shaped like a triangle…sort of.
 Spotting a triangle pattern on a price chart is dead simple. You will have large price fluctuations eventually leading to a point. So, over time, the price becomes less and less volatile each day.
Not all price charts are going to have triangle patterns on them.
There are some stocks which are far too volatile for there to be a distinct pattern on them, but the vast majority of ‘stable’ stocks (or currencies) will have triangle trading patterns on them, even if the pattern is ridiculously small.
In theory, you can use triangle trading patterns to check how the value of a stock or currency has changed over the course of many years.
Although, I don’t really see much value in it. Most people who use triangle trading patterns are going to look at how the price changes over the course of a few days, or a month at a push.
I am going to talk a little bit about how you can benefit from triangle trading patterns in a short while. For now, however, I want to talk more about the types of pattern that you will see. These can be split into a few different categories.
Symmetrical Triangles
This is the type of triangle that you are most likely going to be spotting on a price. They are a bit more difficult to spot unless you are actively looking for them.
With symmetrical triangles, each time the price moves up, it won’t be as high as the last time it moved up on the price chart. Each time the price moves down, it won’t be as low down as the last price decrease.
If you drew a trend line on the chart along the ups and downs of the price, you will find that the trend lines work gradually towards the same point i.e. in a triangle shape.
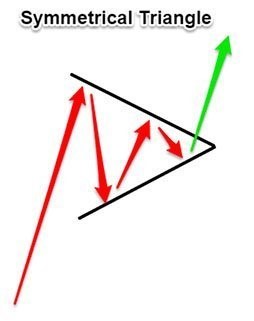 Symmetrical triangles are somewhat odd triangles. It shows that buyers and sellers of a stock are in a battle, but they are pretty evenly matched.
Although, one side is eventually going to give in and allow the price to ‘breakout’, which is something that I am going to talk about in a short while.
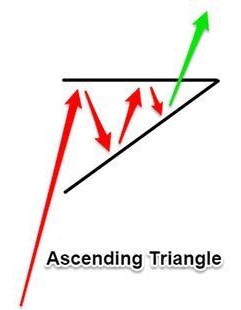
Ascending Triangle
With this type of triangle, the swing lows are gradually getting higher and higher. The swing highs are not fluctuating that much and, instead, get closer and closer to the swing lows. This signifies that the stock value is becoming more and more stable.
You will know that you have an ascending triangle if you can connect two of the swing highs and two of the swing lows with trend lines.
 Obviously, you are not always going to form an actual triangle if you draw trend lines on the chart, but you will easily be able to spot the swings in the value of the stock are getting closer and closer.
This type of triangle shows that there is a maximum price that buyers are currently willing to pay for a stock, and that the price is not going much beyond that (if at all).
However, the overall value of the stock seems to be going up for the sellers, as they are able to offload their stock at a higher and higher price, even if they are not seeming to get past the cap that the buyers have put in place.
Descending Triangle
This is the opposite of the ascending triangle (obviously). With this, the swing highs are getting lower and lower to the point that they start to converge with the stable swing lows.
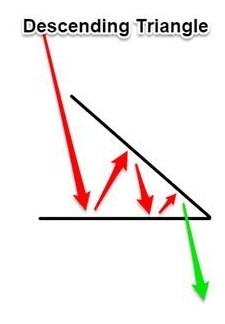 A descending triangle signifies that the price of a stock is getting lower and lower (this much is obvious), but it also means that whatever is causing the price to get lower is starting to stable out a little bit.
Obviously, nobody wants the value of a stock that they own to get lower, but getting lower is a lot better than having your stock in free fall, and having your stock stick on an ascending triangle means that you may not want to get rid of it at that exact moment in time, because it may not break out of the pattern.
You will draw a descending triangle on your price chart in the same way you would draw an ascending triangle i.e. being able to connect two swing highs and two swing lows.
Once again, the lines may not connect perfectly, but you should be able to spot a clear trend when you are drawing them on the chart and that is all that you really want; a trend.
Descending triangles never really signify a good thing.
In my experience (and probably the experience of thousands of traders out there), is that while there seems to be a baseline for the minimum value of the stock for a while, it is likely that the price of the stock will break that trend eventually and start to fall even further.
When you have swing highs and swing lows start to connect up like that, it is very rare that the price will climb drastically in the near future, simply because the market has already settled on that new ‘low’ price.
Of course, you will still want to keep an eye on the news to see whether there are changing market conditions which could push the price up a little bit more.
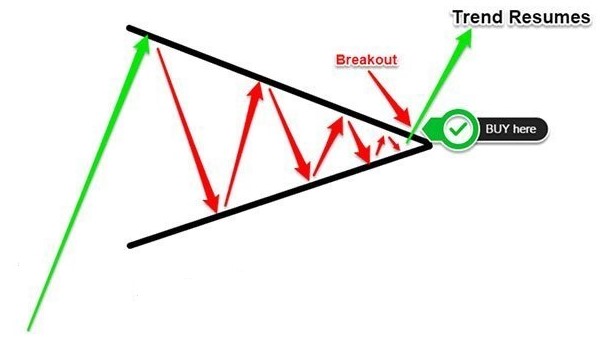
Breakout Strategy
This is how the vast majority of traders will use triangle chart patterns.
As a trader, you will know that eventually patterns will ‘break’. They can’t continue forever. At some point either the buyer or seller is going to give in and the price will start to shift out of the narrow confines that the triangle has forced upon it.
This is what you need to look out for, because that will signify when you need to make your purchase.
Thankfully, the breakout strategy is easy to follow. You just need to bear these two rules in mind:
- If the price goes above the upper trend line, buy.
- If the price falls below the lower trend line, short sell.
 In most cases, since you are making your move when the stock value is starting to move away with the triangle pattern, you will make a little bit of cash (or at least keep your losses to the absolute minimum).
It is worth noting that the way in which people draw their trend lines will differ. This is because we all draw our lines in a slightly different way.
Remember what I said about maybe needing to manipulate the lines a little bit so they join up properly? This may mean that you either spot when a stock price is breaking out sooner or later than other people.
Although, to be honest, this is probably not going to be that much of an issue. I assume that you are the type of person who is keeping an eye on the value of a stock all the time.
What Will Cause A Stock Value To Breakout From The Chart?
In most cases, it is going to be because either the sellers or buyers just couldn’t hold out any more and they have given up. This will cause a price shift.
Generally speaking, this is going to be something which happens pretty quickly. In most cases, it probably won’t take more than a week or two for the value of a stock to shift out of the triangle pattern. Although, in the case of penny stocks, it may take a day or so (if that!).
In some cases, it will be due to market conditions. Although, this is going to be rare.
In many cases, buyers and sellers of a stock will have a rough idea of the way in which the market is going to head, so that has already been ‘priced’ into the chart.
There are very few surprises out there which can completely shift the value of a stock at a moment’s notice.

There Will Be False Breakouts
These happen, sadly, a lot more often than you may think. You may spot that a stock is breaking out of the pattern, but then it reverses course quickly afterwards.
There is not a lot that you can do about this, other than to be encouraged to use stop losses to minimise your risk.
You can use false breakouts to your advantage anyway. For example; if you have decided not to get in on a trade because you didn’t know the way the stock was going to go, once you have seen it reverse course, you may jump in and make a small amount of cash.
Although, once again, you will want to make sure that you have the stop loss in place.
Anticipation Strategy
This is something which is a bit more complicated to follow and may require experienced trading knowledge.
One of the reasons as to why the anticipation strategy is so complex is because you are going to be competing with other traders who have a lot more knowledge about the way in which a market works than you do.
Remember; many traders are shifting millions of dollars a day. You may be doing a few thousand (at a push).
With the anticipation strategy, you are trying to predict the way in which the market is going to trend.
As I said previously; if you have a descending triangle, this is pretty easy to predict. The price is almost always going to go down with very, very few exceptions.
You can read the news if you want, though this may indicate that market conditions are going to change a little bit.
The major benefit of the anticipation strategy is that you could potentially make more money.
This is because you are predicting the way the pattern is going to go before the pattern is broken. Although, of course, you also could end up losing a lot more money if you ‘guess’ incorrectly.
If you believe the price is going to go up, then you should buy as close to the lower line as possible. If you believe it is going to go down, then set your stop price just above the upper trend line, and short sell near the bottom.
Always Have A Stop Loss
This is probably one of the best tips I can give you. If you are planning to trade, then always have a stop loss in place. It helps to minimise your risk.
 Even if you think the value of the stock is going to go the way you want, you should still have the stop loss in place.
As any trader will tell you; stocks are unpredictable. They could break at a pattern at any given moment, and you probably do not want to be taking huge losses as a result.
Do Not Rely On Triangle Chart Patterns Alone
Triangle patterns are a small group of patterns that you can use. They do not occur that frequently when you are looking at price charts.
Most stocks are going to be far too volatile (or too stable) for there to be an actual triangle that you can spot on the charts.
However, it is still worth having them in your arsenal because once a triangle pattern can be spotted on the chart, you will likely make some cash.


